BI Tools Have Got to Be Plug-and-Play

Your business intelligence tool not only needs excellent performance, it needs to be plug-and-play, which means it’s got to be easy to use.
In a recent blog, we took a look at the concept of a data lake—how people are storing data, and how fast that data is coming in. Often we’re processing that data in several different places with different analysts. It's important to figure out how all this data feeds into different architectures as you decide how to build.
Visualizing Your Data
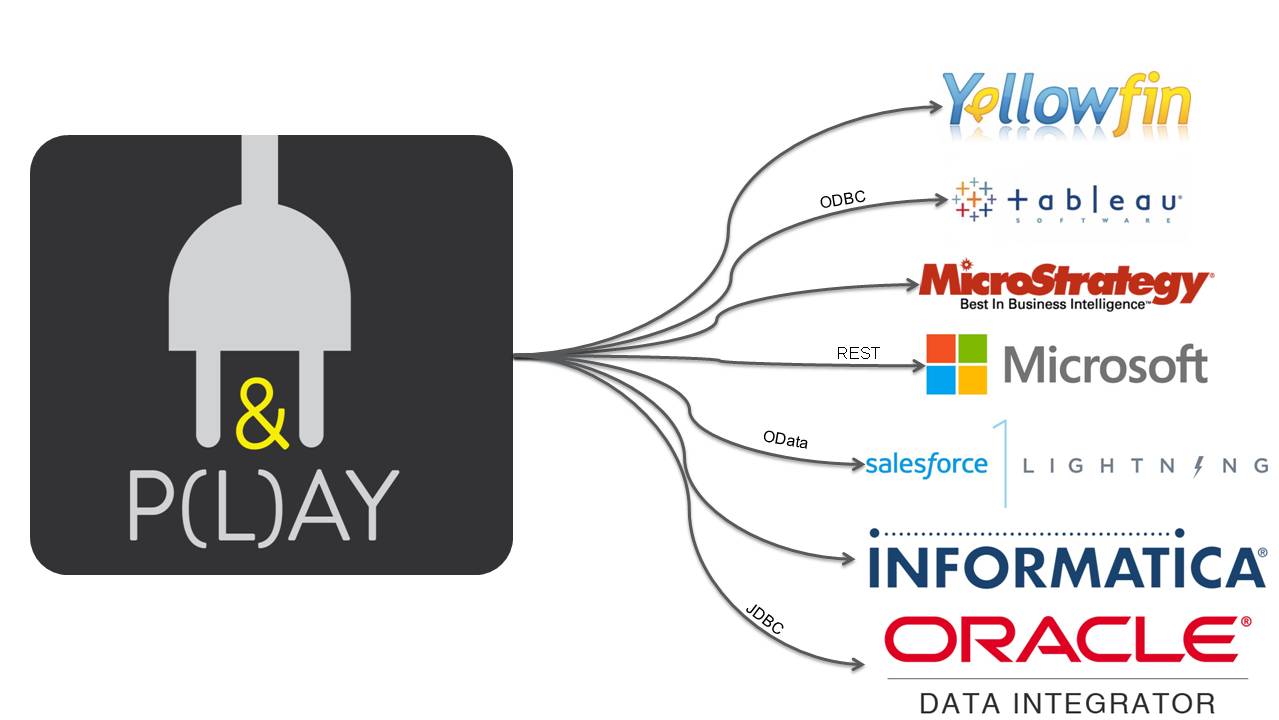
It’s all so you can visualize your data. You want to be able to make sense out of it, so you can make decisions in your business. You might be using Yellowfin, Tableau, Informatica, ODI—you may be using any one of these kinds of business intelligence software. Another requirement on top of performance is that your data-visualization tool or data integration software has to simply plug in and work. Your BI tool has got to be plug-and-play, which means it’s got to be easy to useYour BI tool has got to be plug-and-play, which means it’s got to be easy to use.
Figure 1 (below): We believe in standards and broad compatibility, and we work with all of these to drive, connect and optimize your data performance. Areas where we are brought in include BI, data warehousing, ETL, data federation, Salesforce Lightning Connect, Oracle, Informatica, Pantaho, and more.

From the Mine to the Analyst
At the end of the day, the entire process of working with data and the explosion of data sources, getting it to all tie together from capture to storage to mining—why we’re even paying attention to it—is to give our customers an awesome experience. That’s what the benefit of performance really is.
With the right support—when you get the performance story right, when you get the code right—these visualization tools can create something really powerful that makes a huge difference for your business.
Examples include Macy’s application that mines in-store data to figure out what you want, or something like the Yamaha use case where picking the right driver resulted in a 20X performance gain. All of these things feed in and tie together. That’s when you can create a really good experience for both the people in your company writing the code, and the business analyst that has to work through these visualizations and make decisions based on them. Ultimately, it’s the customers that are presented with a good personalized product or service that they want to use.
Fastest in the Industry
The drivers my team and I build here at Progress® DataDirect® are designed to be the fastest in the industry, and we stand behind that claim with award-winning technical support. When you find performance issues in our software, we treat them like defects because we understand how important speed is to your business. You can pick up a free trial today and try it out for yourself, or watch a replay of our Progress webinar, “Industry Insight: Optimizing Your Data for Better Performance,” to learn more. Don’t forget to check back for more insights and insider tips from Progress DataDirect!

