Embedded Reporting (Part 1): The Complete Solution for User-Created Reports

Empower users to turn data into actionable insights with embedded reporting. Learn more about our complete solution that offers user-created reports right within applications.
Data comes at your users like a tsunami: It’s huge, it’s overwhelming and it can’t be stopped. The goal of your reporting systems is to turn that data into information—something that your users can understand and can act on.
The goal of embedded reporting is to go one step further than just “reporting.” Embedded reporting provides that information at the exact point where users need it most: As an integral part of their applications.
And that’s just the first goal of an effective embedded reporting solution. The second goal is even more valuable.
The First Goal of Embedded Reporting
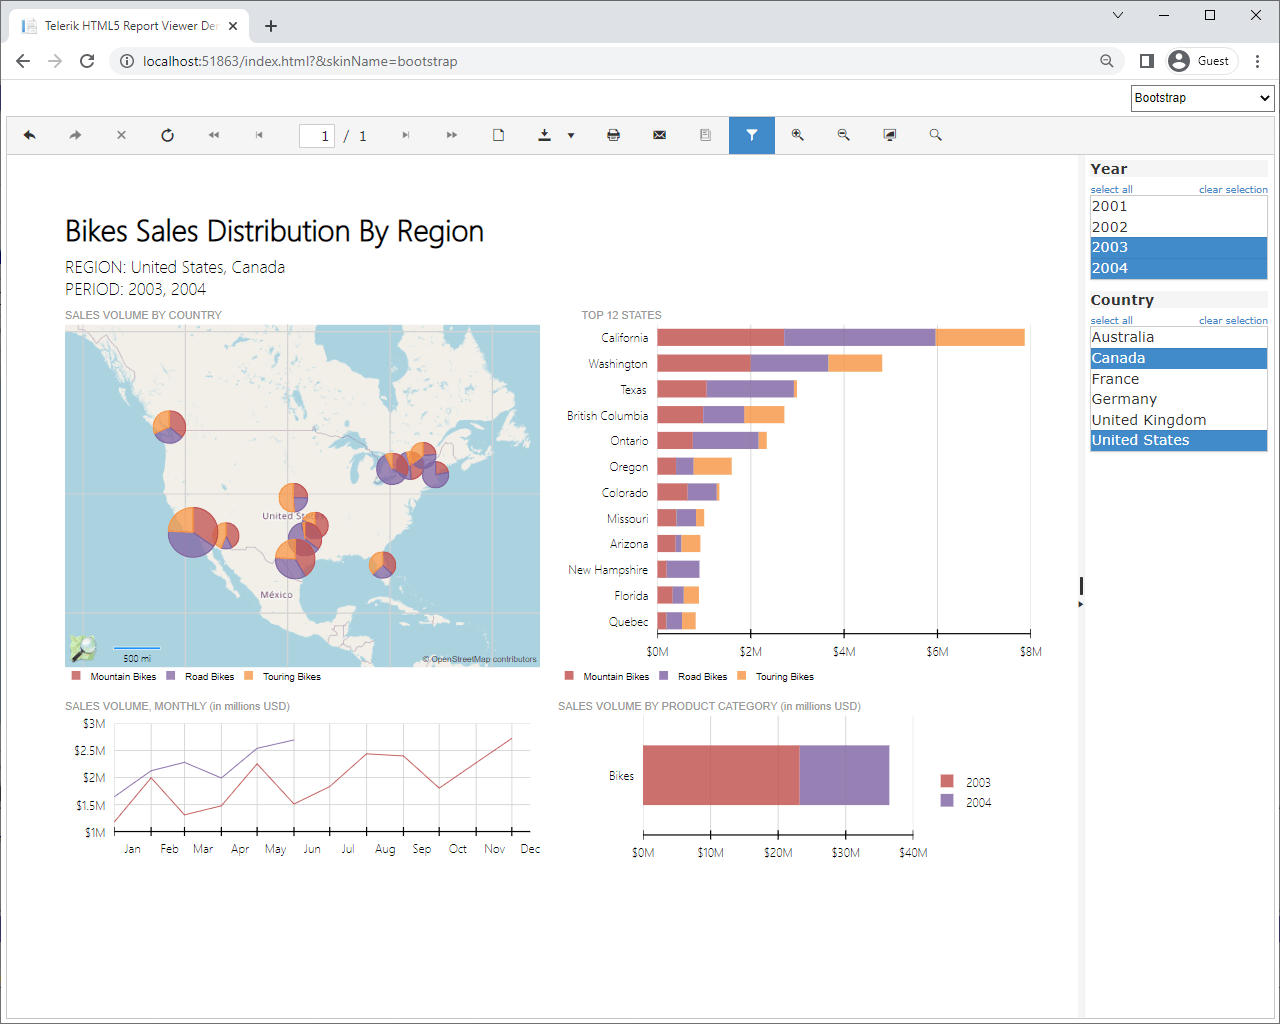
Dashboards are an excellent example of traditional reporting. A well-designed dashboard provides visual feedback, tailored to the user’s needs, that flags the issues the user needs to act on right now. But, when users recognize that they need to take action, they have to leave the dashboard/reporting system and move to some transactional application to actually make the necessary changes. And, in these scenarios users frequently have to refer back to the reporting system to see the impact of their changes.

Embedded reporting eliminates that gap. Users may still need the dashboard to pull together critical information into a single visual that flags key issues. But, with embedded reporting, when the user moves to the application in order to take action, that information is still present, embedded in the application.
In fact, embedded reporting typically reduces user’s dependence on a separate reporting system. With embedded reporting, as soon as users open the application, they have access to the information they need—both to make good decisions and to know if their actions have the impact they want.
And embedded reporting, because it’s part of the application, responds to the user’s action. For example, selecting a product in a sales order application can cause the embedded report to show the related information. Selecting a region in an embedded map-based report can trigger the application to switch to working with that region.
The Second Goal of Embedded Reporting
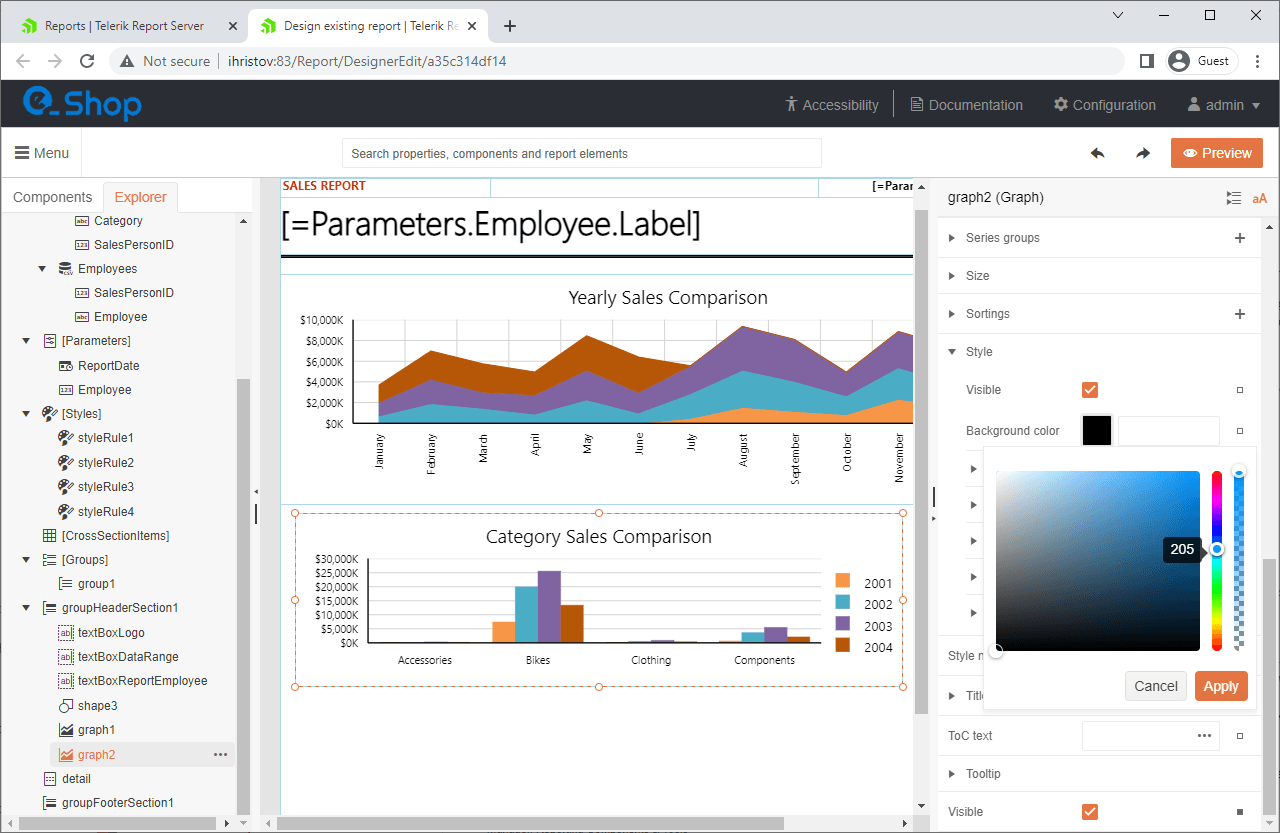
But a complete embedded reporting system goes one step beyond that by also leveraging a fundamental fact: The best person to identify the information the user needs is the user. A complete embedded reporting solution lets users (rather than just IT people) turn the data that‘s overwhelming those users into the information those users know they need.

Most self-serve/end-user reporting solutions include a desktop reporting designer. While useful in supporting traditional reporting, those report designers still separate “reporting” from “acting.” A complete embedded reporting solution also allows users to start creating the reports they need from anywhere in their line-of-business environment. Embedded reporting also includes the viewers that let users integrate those reports into their applications.
So, your first goal is to provide the information that empowers your users to make better decisions. Your second goal—and, in long run, the more important one—is to provide the report creation tools that empower users to turn data into the information they need. A complete embedded reporting solution not only meets both of those goals, it puts the information where your users need it: In their applications.
Ready to Take Advantage of Embedded Reporting?
Progress Telerik Reporting provides all the tools you need to embed the rich, interactive reports your users need in order to analyze and understand their data right into your users’ applications (including letting your users export the results into more than 15 formats, either to distribute or integrate with other analysis tools). Telerik Reporting then lets you go further and empower your users to create the reports they want without ever leaving the applications where they’ll use their reports.
You can leverage these easy-to-use tools in both any client-side web application environment (HTML5/JS, Angular, React, Vue or Blazor) and any .NET application (web or desktop: ASP.NET Core, ASP.NET MVC, ASP.NET AJAX, WinForms and UWP).
If you still have not tried it, you can start a free trial to take a closer look. A renowned support service and an array of resources will help you along the way.
Related Blog Posts

