3 Network Performance Monitoring Metrics to Deal with Performance Degradation

In my 20+ years career, I’ve worked with two types of technologies. Those that took extensive marketing efforts to communicate their value and failed to deliver it, as well as technologies that proved themselves quickly during a single day. Network performance monitoring using flow data is the second case. In this post, I share my experience with NPM techniques, how to take them on in a real environment and what are the typical root causes of performance bottlenecks found in network traffic.
As a network engineer, my personal KPIs were always measured by MTTR (mean time to repair). Whenever my users experienced network related issues, I needed a technology that would help me to isolate the root cause of the incident quickly. I’ve learned this could only be effectively done with an understanding of traffic characteristics across L2-L7 layers. Network performance monitoring metrics ( Round Trip Time (RTT), Server Response Time (SRT) and Jitter), extracted from flow data deliver such an understanding. Let’s take a look how beneficial and complimentary they could be in their struggle with low performance and downtimes.
Network Performance Monitoring Foundations
Network Performance Monitoring is an approach to isolate the root cause of performance issues related to network traffic by measuring a set of performance metrics. These metrics distinguish between data transmission issues (network delays) and application issues so we know which team or a colleague to contact and ask them to resolve the incident, which provides hard evidence of the scope and impact.
This approach works with two main metrics calculated from a passive observation of network traffic:
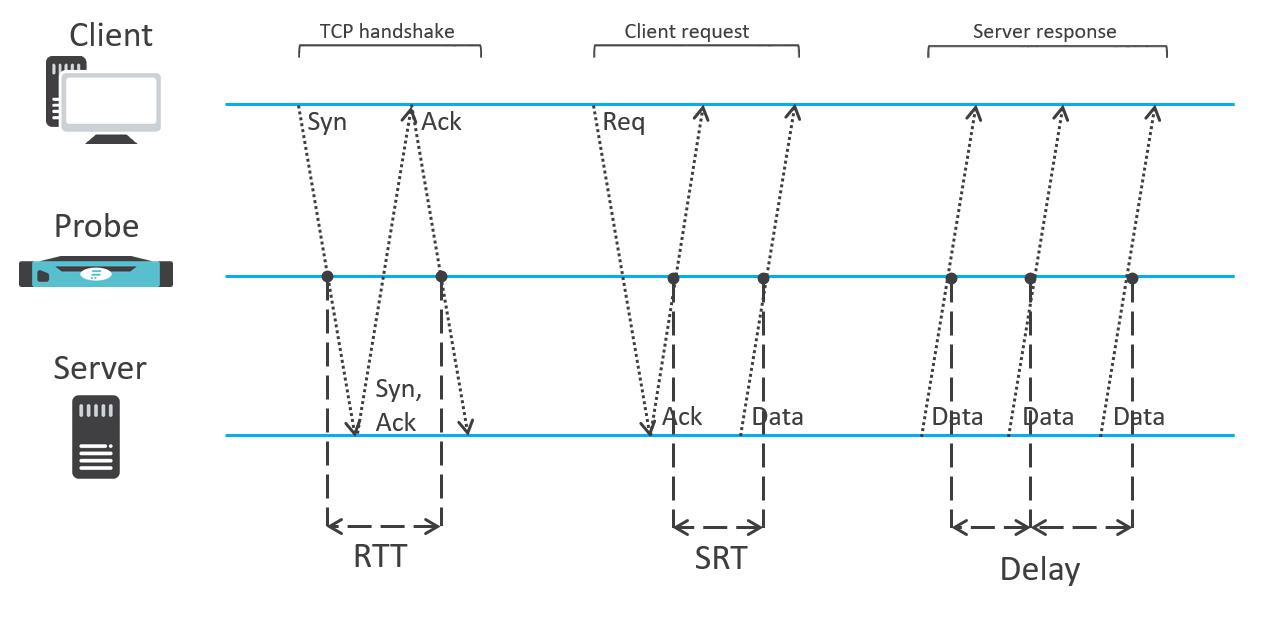
- RTT (Round Trip Time) - data transfer time of a packet being transmitted from client to server and back. Also called network delay. It is calculated by observing the time needed to establish a TCP session (monitoring a TCP handshake). This metric is available for TCP traffic only.
- SRT (Server Response Time) - delay on the application server between a client request being received and the data packet, with a response being transmitted to the client. Simply, we can say that this metric is calculated as the time difference between acknowledgement (TCP ACK) and the first data packet of the response. Again, this metric (with some exceptions) is available for TCP traffic only.
Fig1 Network Performance Metrics measurement principle

1. Round Trip Time
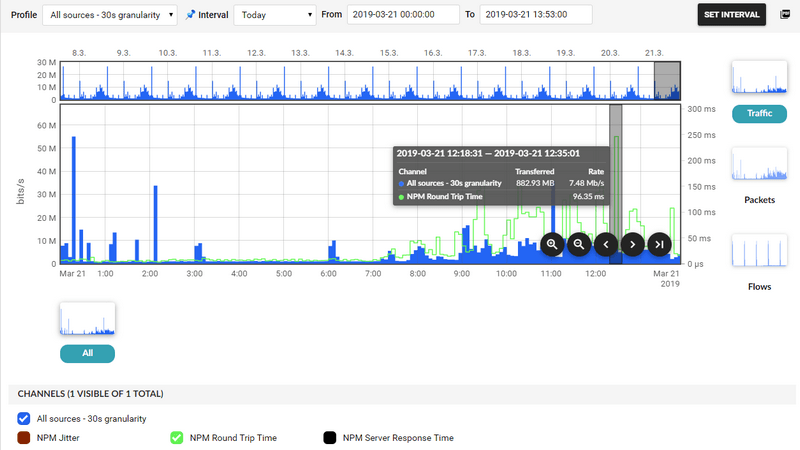
A single value that models the performance of the network itself. A typical value in enterprise networks in one location is less than 1 ms (even tens of microseconds) as on the local network, e.g. in the data centre there are no long distances that packets need to travel and/or network devices introducing additional delays. So what does it mean if you experience a RTT of hundreds of milliseconds? The root cause is always the network in this case. An application has no impact on the TCP handshake as this is part of the TCP/IP stack implemented in the operating system itself. It would require an operating system malfunction to influence this metric which won’t happen in practice. Here are some typical root causes in such situations.
Overload of network devices, especially routers
High packet rates impact buffers in network devices where packets need to wait to be dispatched. QoS can help to prioritise critical services to a certain extent but experiencing a DDoS attack may lead to network congestion and increased values of RTT.
Clients working from remote locations
Complaining about slow application responses might not always be the case. Having an RTT of 500ms when connecting from home through a VPN to a company data centre means that just to transmit the packet takes half a second and any application will look slow from a user’s perspective.
Cloud applications
This case is pretty similar to the one when clients are working from home. An RTT of 10ms for applications hosted in the company data centre is not something we can expect after migrating to the cloud. In standard cases, application traffic goes through the public internet where an RTT of 100ms is actually a reasonable result. That’s why SaaS providers use content Delivery Networks (CDN) and proxy servers to host the application as close to customers as possible to reduce the network delay. For the same reason large companies purchase dedicated lines to connect their infrastructure directly to cloud providers. When baselining cloud application traffic, we can observe deviations in RTT that usually mean network degradation that is out of scope of the application provider.
Ethernet vs. WiFi
Everybody would probably say that WiFi connection results in more network delay than wired connection. But is that true? And what is the real difference? In my practical experience, the usual performance difference between wired Ethernet connection and WiFi is around 10ms. So 10ms is the average penalty you get when going through WiFi instead of wired Ethernet connection. And we are still talking about ideal conditions. In reality, we can observe much higher values and significant deviations as WiFi struggles with environmental conditions, e.g. interference of different WiFi networks that use the same frequency.
Performance bottleneck caused by heterogeneous port speeds
This case is kind of special. Imagine a 10G backbone while servers are connected through 1G, especially when multiple servers share such a 1G uplink. Numerous clients can easily generate traffic that will spike above 1G port capacity, saturating switch buffers, which leads to packet drops. Such packets need to be retransmitted and consecutively users experience a network delay.
Fig 2 Round Trip Time peak in network traffic visualisation (Flowmon GUI)

2. Server Response Time
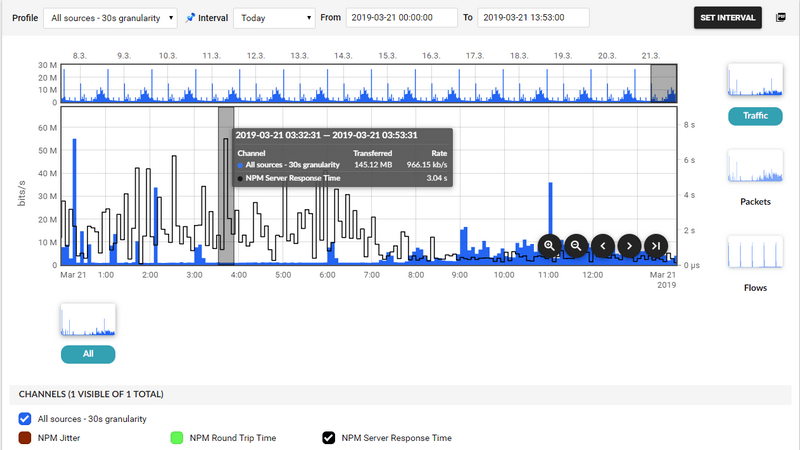
This metric represents the request processing time on the server side and so represents the delay caused by the application itself. The measured server response time expresses the time difference between the predicted observation time of the server's ACK packet (prediction based on observation time of the client request and previously measured RTT value) and the actual observation time of the server's response. The measurement can't rely on observing an ACK packet from the server since the ACK packet might be merged with the server’s response. Sending ACK together with first response packet leads to an SRT of 0 value, which is not what we would like to measure. SRT measurement is not limited to TCP traffic only, as some UDP traffic can be measured as well. Flowmon provides SRT measurement of DNS traffic. Client and server are distinguished based on whether 53 is the source port (server) or destination port (client). The measured server response time expresses the time difference between observation times of the client's request and the server's response. SRT enables a performance measurement of the whole application, per application server, per client network range or even individual clients. This enables finding correlations between application performance and a number of clients or a specific time of the day. Using this metric together with RTT answers the ultimate question. Is it a network issue or application issue?
Fig 3 Server Response Time peak visualisation (Flowmon GUI)

3. Jitter - variance of delay between packets
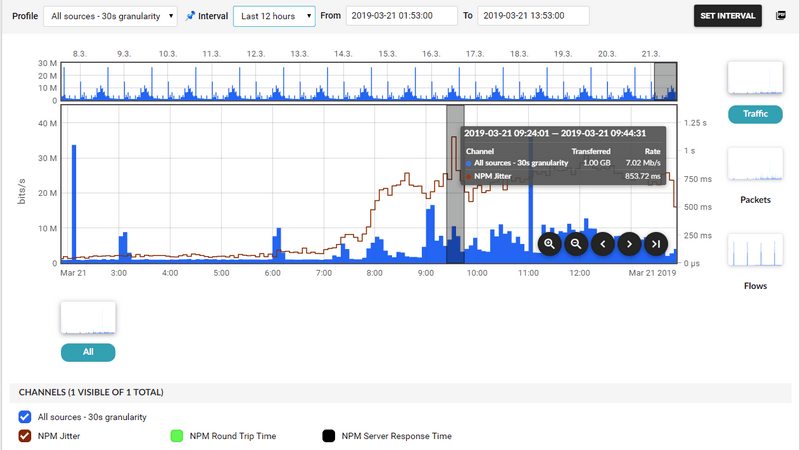
Jitter can show irregularities in packet flow by calculating the variance of individual delays between the packets. In an ideal case, delay between the individual packets is a constant value, which means that jitter is 0. There is no variance of measured delay values. In reality, having a jitter value of 0 doesn’t occur as a variety of parameters might influence the data stream. Why should we measure jitter anyway? Jitter is critical and has the main value for assessing the quality of real-time applications, such as conference calls and video streaming. But also when downloading, e.g. a Linux distribution ISO file of Linux distribution from a mirror, jitter may indicate an unstable network connection.
Fig 4 Jitter peak visualisation (Flowmon GUI)

Summary
From my experience, those network administrators who have used Network Performance Monitoring metrics can considerably improve the performance of the network as well as contributing to the improvement of the application side. In return, their users as well as company management have noticed and appreciated better user experience.
Continuous monitoring and baselining of Network Performance Monitoring metrics helps network administrators to identify an issue in the network itself, specific connections or applications. It’s valuable to reveal problems before users do and prevent complaints on performance degradation. Long term monitoring of network performance metrics (RTT, SRT, Jitter) can help to predict future needs (network capacity planning) and incidents, e.g. growing SRT for company information system over weeks means application server overload that should be solved before breaching SLAs. We can, for example, allocate additional resources for the application or introduce multi-server architecture with load balancing.
Understanding RTT, SRT and Jitter is definitely worth using for every responsible network professional. These three are essential, but not the only ones. Another interesting performance metric is called retransmissions, which I will explain next time. If you want to know how network performance metrics work in Flowmon, download our free trial.
