Tutorial on OData Access from D3.js Javascript Library

Spend less time accessing data from proprietary REST APIs and more time building cool apps with this short tutorial.
A picture is worth a thousand words—especially when you're trying to gain insights from your organization’s data to help you overcome different challenges. Today, most organizations have their data in Big Data, SaaS or Relational data sources and use different analytics tools to visualize their data.
Conventionally, most of these tools need a driver for your data source to connect, fetch and visualize the data, and these operations can be done only on specific platforms. With an increase in computational power on most of the platforms, you would want to create visualizations on mobile devices or on any platform of your choice—but are you limited by the connectivity solution to your data source?
Less Time Accessing, More Time Building
OData allows developers to spend less time accessing data from proprietary REST APIs and more time building cool apps. Using a standard REST API, developers connect to an ecosystem of data sources.
To demonstrate the above scenario, Saikrishna Teja Bobba, a Developer Evangelist from Progress, has created a Node.js based web application that uses DataDirect Cloud’s services to connect, fetch the data from 50+ data sources and visualize them using D3.js, a JavaScript library to generate dynamic visualizations. You can access the web application here, which you can use on any platform to create simple bar charts.
The following tutorial shows you how he built a simple visualization application that can be used by anyone.
Using REST and OData
- If you need a sample OData URL, you can start with a trial of DataDirect Cloud by following this tutorial to configure any data source.
- To visualize your data, you need to select your data source and the table within that data source that you intend to use for visualization.
- To get a list of data sources that you have defined on DataDirect Cloud, you can use REST API to get the list by sending a GET request to this endpoint: https://service.datadirectcloud.com/api/mgmt/datasources. Please find below the code snippet that you can use to make a GET request from Javascript:
var httpRequest = new XMLHttpRequest(); httpRequest.onreadystatechange = function () { parseResponse(httpRequest) } httpRequest.open("GET", URL, true); httpRequest.setRequestHeader("Authorization", "Basic " + btoa(username + ":" + password)); httpRequest.send(null);- Once you select your data source you can fetch the tables in that data source using DataDirect Cloud’s OData Service. To do that you can make a GET request to the endpoint: https://service.datadirectcloud.com/api/odata/<DataSourceName>/$metadata. This returns an XML response with the metadata of all the tables and their respective columns for the specified data source.
- Using the metadata, you can determine which columns can serve as a measure and dimension, dynamically based on the selected table.
- After choosing the data source and table, to fetch the data using OData service you have to make another GET request to the endpoint: https://service.datadirectcloud.com/api/odata/<DatasourceName>/<tableName>?$format=json. This fetches you all the data in the table that you have specified. You can refine your dataset results from OData Service using query options that begin with $ character. You can learn more about these query options here.
- By this stage, you should have the data and all that remains is to generate a bar chart or your favorite visualization using D3.js library. You can use D3.js libraries by simply inserting this script tag in your HTML.
<scriptsrc="https://d3js.org/d3.v3.min.js"charset="utf-8"></script>Below is a code snippet to generate a basic bar chart:d3.select('#bar-chart').append('svg').attr('width', 720).attr('height', 400).style('background', '#dff0d8').selectAll('rect').data(chartdata).enter().append('rect').style({'fill': '#3c763d', 'stroke': '#d6e9c6', 'stroke-width': '5'}).attr('width', 40).attr('height', function (data) {return data;}).attr('x', function (data, i) {return i * (40 + 20);}).attr('y', function (data) {return 400 - data;});//chartdata is an array of values that you would like to represent as a bar chartFor more tutorials on using D3.js to generate visualizations, you can visit this page.
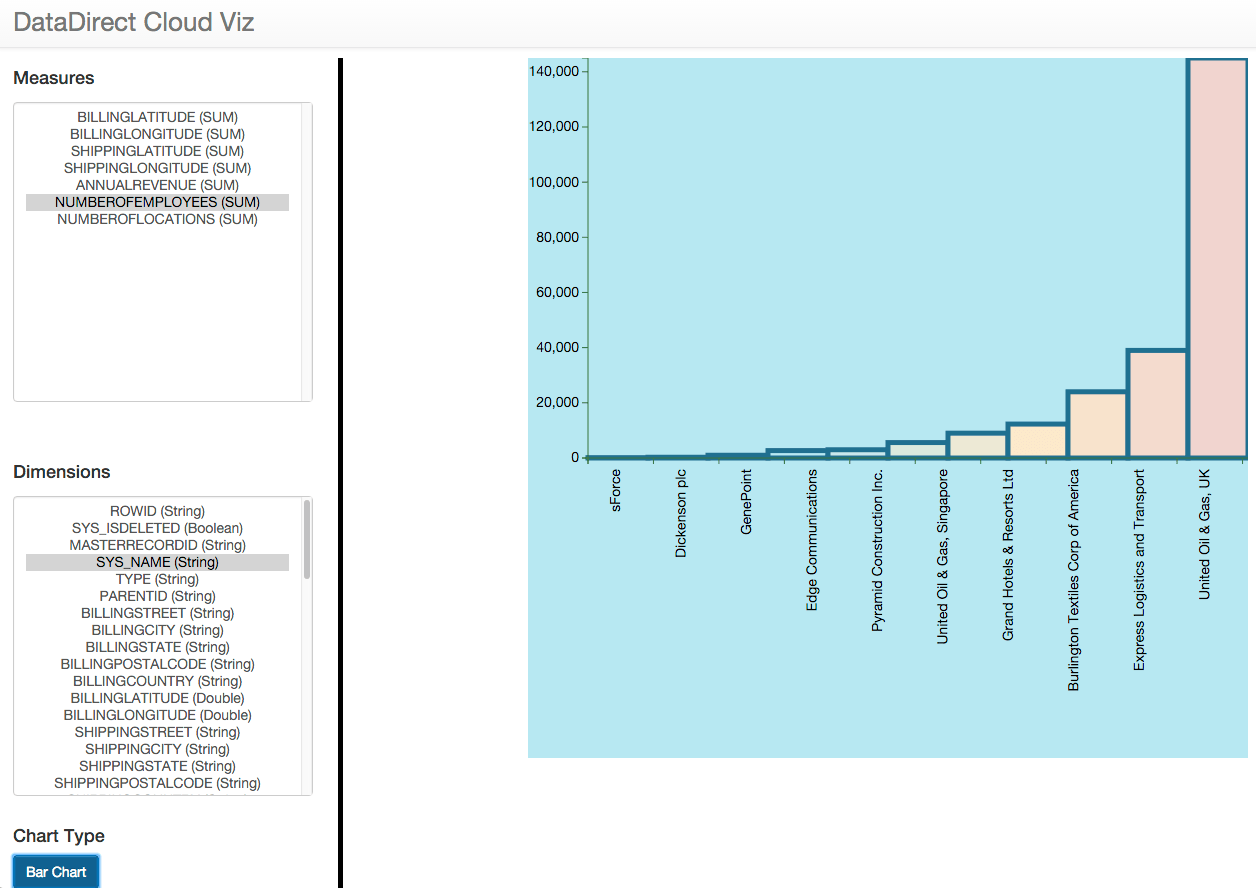
- The following is a simple bar chart diagram that was created using the application that shows the data from Salesforce:

Get Started Today
Feel free to try this application and generate simple bar charts on Mobile, PC or any other platform. The code for this application has been pushed to Github for your reference.
This web application is a simple example of how useful DataDirect Cloud’s REST and OData services can be used when you are developing applications that can be used on multiple platforms. In fact, you can also use this approach to create a hybrid mobile app using the Telerik Mobile platform that can be installed on iOS, Android and Windows to generate various visualizations.
With access to over 50+ data sources including core back office business systems running on Oracle, IBM DB2 or Microsoft SQL Server, the possibilities are unlimited with DataDirect Cloud services. Get a DataDirect Cloud trial and spend less time getting data and more time showing it off.
