Flow Analysis Using Filters – Exploring DNS Communication of Servers

In this step by step guide you will learn how to use filters to analyze network traffic and better understand your network.
Filters in Analysis (part of Flowmon Monitoring Center) are a very powerful feature which allows us to get the information we are looking for or just to analyze what is happening in the network. Today, we will start with simple filters to see overview of DNS communications and end with more complex filter which will help us to understand what servers and services are running in the network.
First of all, we want to get an overview of DNS communication in our network and find out what kind of servers we have. Let’s start by navigating to Flowmon Monitoring Center (FMC) → Analysis and set your profile to All sources.

Scroll down to Advanced analysis and switch from Statistics tab to List of flows.
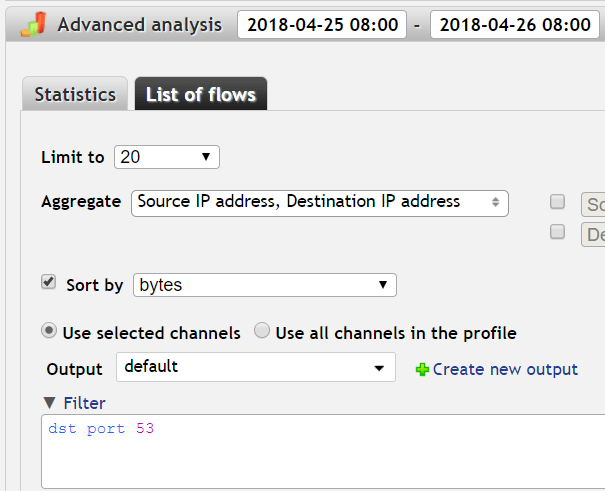
Select the time interval (we'll use the last 24 hours in this example) and Limit results to 20, Aggregate by both source and destination IP and Sort by bytes. Use the default Output (want to see both IP addresses) or create your own with the columns you want (more in Flowmon User Guide, Chapter 7.6.9 List of flows).If we look at the
List of TCP and UDP port numbers, we can see that the Domain Name System (DNS) uses port number 53. This is the port which DNS servers use to listen for requests. We can look for all DNS requests by using the filter expression “dst port 53” (destination port 53).
Our filter:
dst port 53
Now press the Process button.
This query returns the expected traffic going to our DNS server with IP address 192.168.0.1 (dst ip). It also shows clients of DNS servers (src ip).
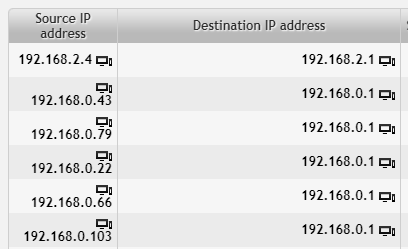
However, we don’t want to sift through all the results containing our own DNS server, because it’s just regular traffic. We want to investigate irregularities. Let’s exclude our DNS server from the results.
To do that, we need to know 3 things:
- How to match destination IP address.
- How to flip the expression to exclude the match instead of including it (i.e. expression negation).
- How to connect several expressions together with logical operators and/or.
Matching destination IP address is simply “dst ip 192.168.0.1”. To negate (i.e. to exclude all results matching) an expression, we need to add the keyword “not” in front of the expression. And finally, to connect expressions together we can use the keyword “and”.

Our filter now consists of two expressions joined together “dst port 53 and not dst ip 192.168.0.1”.
dst port 53 and not dst ip 192.168.0.1
The results are much more diverse now.
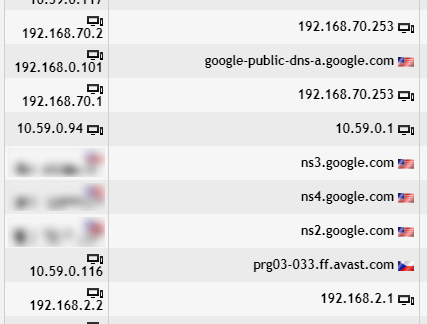
However, there is still a lot of noise. We want to investigate only the DNS requests coming from our internal network, therefore we include only IP addresses such as 192.168.0.101, 192.168.70.2, 192.168.70.1 and 192.168.2.2. Of course we can write a very long filter expression “src ip 192.168.0.101 or src ip 192.168.70.2 or ...”, but listing all the IP addresses would be a tedious task. Or we could use negation and simply exclude internet traffic.
Another way is to use the expression for source network “src net 192.168.0.0/16” and connect it together with the rest of our filter with “and”.

dst port 53 and not dst ip 192.168.0.1 and src net 192.168.0.0/16
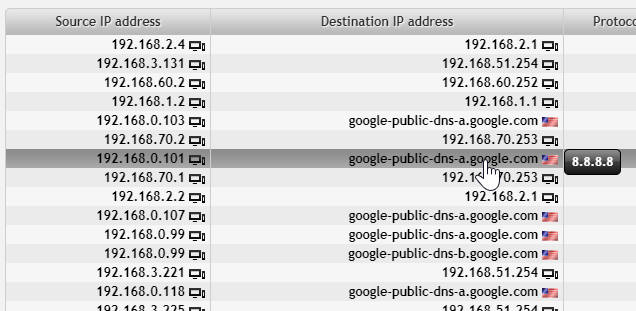
There are a couple of results with Google public DNS. Hovering over reveals IP address 8.8.8.8. Let’s exclude these from our results (and while we are at it, we might also exclude 8.8.4.4). We can list both addresses or use the network expression “not dst net 8.8.0.0/16”.
Our filter:
dst port 53 and not dst ip 192.168.0.1 and src net 192.168.0.0/16 and not dst net 8.8.0.0/16
Our results:
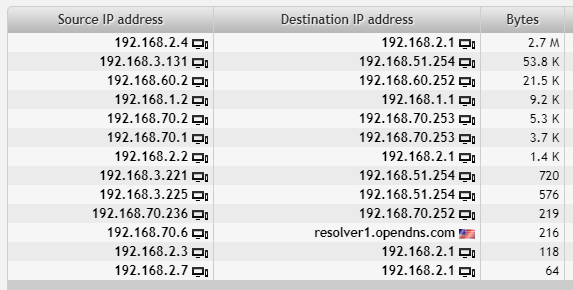
We want to check our servers and the most important services running on them. Our knowledge of the network is that our servers have lower IP values (eg. 192.168.2.2) while workstations and other devices have IP addresses with higher values (eg. 192.168.3.221). We could change our filter again, but the result is such a short list that there is no need.
Let’s look at the servers on the right. All of these machines were sending DNS requests to DNS servers within our network, however it wasn’t the expected default DNS server (192.168.0.1). We want to investigate them further (we will look at 192.168.2.4, 192.168.1.2, 192.168.2.2, 192.168.2.3 and 192.168.2.7).
Our next step is to open a new tab in Analysis. Use the plus icon to open it.

Alternatively, open the second browser window/tab and navigate to the same location (FMC > Analysis. Scroll down to Advanced analysis and switch from Statistics tab to List of flows). Or simply duplicate the tab if your browser has this feature.
Set the same time interval as in the previous window/tab. The important step is to Aggregate by Destination port. Sorting by bytes is just for convenience.
In our Output we want to have these columns: Bytes and Destination port. Use the predefined one or create/customize your own.
We want to investigate the first device from our previous results with the IP 192.168.2.4. Our filter is going to be:
dst ip 192.168.2.4
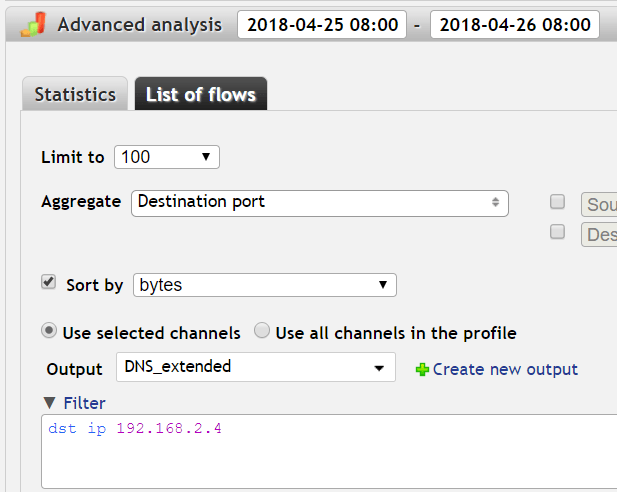
Once set, press the Process button.
Our results:
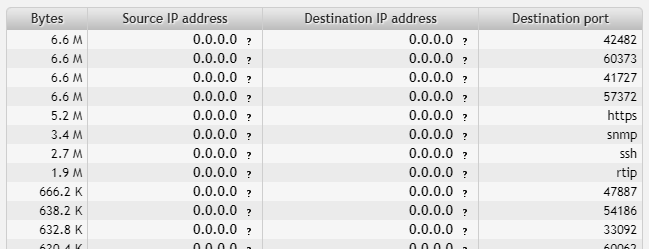
From the numbers of destination ports in use we can deduce the purpose of the machine 192.168.2.4. You can hover over records of known ports (such as HTTPS or SNMP) to reveal the actual port number.
Let’s take a look at ports in use (1.9 to 6.6 Megabytes):
- 42482
- 60373
- 41727
- 57372
- HTTPS (443)
- SNMP (161)
- SSH (22)
- RTIP (771)
For now we will ignore higher port numbers (you can adjust the threshold as needed):
dst ip 192.168.2.4 and dst port < 10000
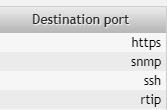
Port number 771 is sometimes associated with RTIP (IANA) or ipcserver (adminsub.net), but in our case it’s an ICMP communication. We can exclude ICMP in our filter by adding “not proto icmp”.
dst ip 192.168.2.4 and dst port < 10000 and not proto icmp
The machine is using HTTPS, SNMP and SSH ports. There might be an SNMP agent listening on port (161). This is probably a http server.
A similar investigation can be done for machines 192.168.1.2, 192.168.2.2, 192.168.2.3 and 192.168.2.7.
192.168.1.2

Ports:
- 16396
- dls-monitor (2048)
- 16392
- 16394
- 16390
Ports 16390-16396 correspond to RTP and RTCP (audio and video streaming). Port number 2048 is sometimes associated with dls-monitor, WCCP protocol in Cisco IOS and shiva/spider integrator routers (threat) listening on this port (Speed Guide). However, this is not the case. Port 2048 is an ICMP communication and we can easily verify this assumption by adding an expression to our filter (see below).
Excluding ICMP communication (to check port 2048):
dst ip 192.168.1.2 and not proto icmp
We can see that our assumption about ICMP was correct, port 2048 is no longer in our results:

192.168.2.2

Ports:
- mysql (3306)
- blackjack (1025)
- SNMP (161)
Probably a Windows machine running a database server, receiving SNMP. Port 1025 belongs to the range for dynamic allocation by Windows or it might be infected with a trojan (there are several trojan viruses associated with this port).
192.168.2.3

Ports:
- microsoft-ds (445)
dls-monitor (2048)
Port number 445 is used by Microsoft Directory Services - a large volume of data (3.9GB) was transmitted. Port 2048 is an ICMP communication.
192.168.2.7

Ports:
- pn-requester (2717)
- ms-sql-s (1433)
- microsoft-ds (445)
- SNMP (161)
Port number 2717 is used by PN REQUESTER (IANA). Microsoft SQL Server is listening on port 1433 (T1 Shopper). Port number 445 is used by Microsoft Directory Services. About 3MB were used by SNMP on this machine. We can conclude that this is probably a database server (Windows machine with MSSQL database).
Now we know which servers in our network are not using the default DNS and what kind of services they offer. One of these machines might be worth checking for viruses (blackjack). All of this information was gathered only by simple filtering in Flowmon and by looking for port numbers.
If you want to try what you have learned today, check out our online demo or download free trial and start with flow monitoring in your network!
