Windows Performance Counters Using GUI and PowerShell


When a Windows server is running as expected, no one notices. But as it begins running low on resources, a system administrator typically finds out quickly just how important that server is. Performance suffers and Windows performance counters can help. It's important for admins to track resource utilization over time and get alerts on when resources such as CPU, disk, memory and network usage are showing anomalous behavior. This is where performance counters come in.
Performance counters are an extensive system of metrics that can be tapped into through a number of means. Nearly anything an admin can think of has a performance counter that's capable of exposing just how much a server is being utilized. In this article, we're going to go over how to read these performance counters and look at some common counters that, if proactively tracked, will result in fewer headaches down the road.
Methods for Checking Performance
There are two main ways to read performance counters on a Windows system; through the Performance Monitor application or via command line (probably PowerShell). Let's use the GUI first. To get to the Performance Monitor, run perfmon.msc from the command line or type Performance Counter in the search box. Click on Performance Monitor and you will see a running graph of % Processor Time (a common performance counter).
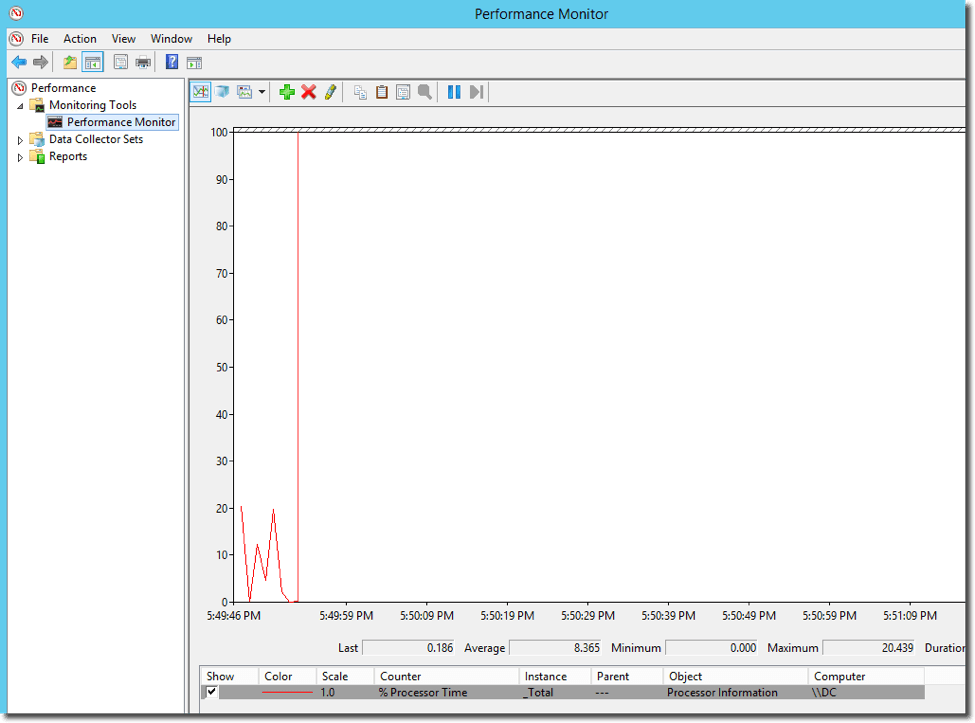
This is actively tracking the total processor usage determined by the Instance column at the bottom. Let's now add a couple of other common counters to this graph. To do this, I'll click on the green "plus" sign at the top and pick % Free Space from the LogicalDisk group and Available MBytes from the Memory group.
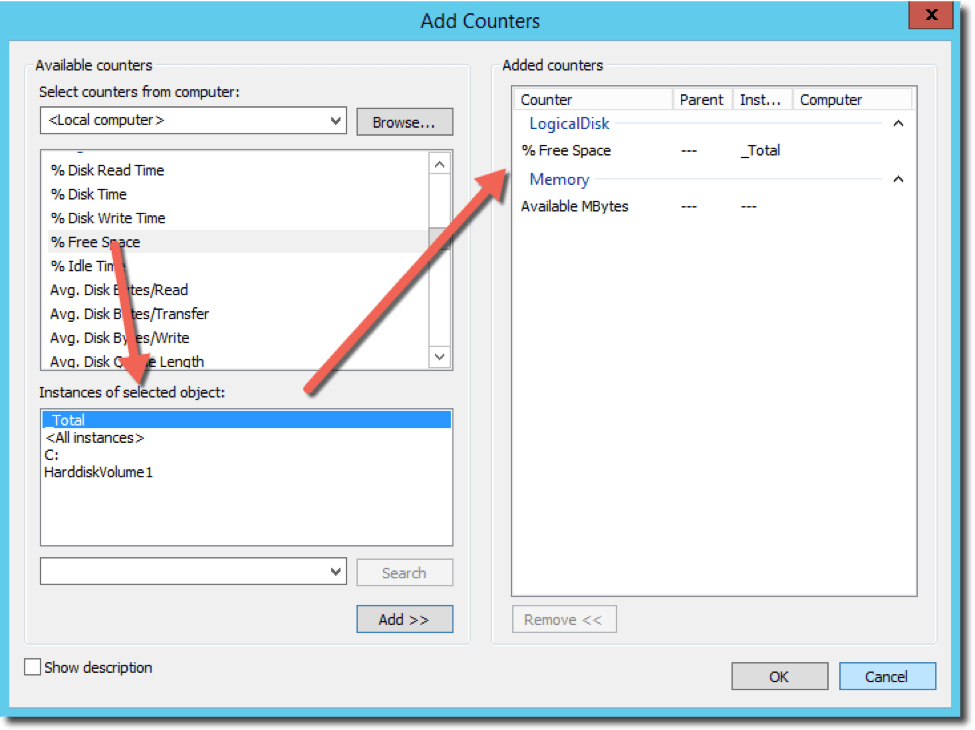
These are performance counters that track, in real time, how much percentage of free space all disks combined or single disks are consuming. Available MBytes tracks how much RAM is still available on the server. Once I add them, you'll see that it immediately begins monitoring each counter once a second.
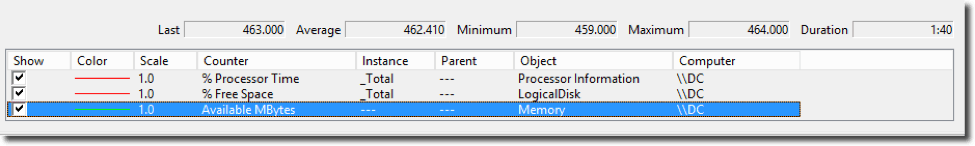
An administrator can track as many counters as necessary here on the local or remote computers. The Performance Counter is nice for seeing point-in-time snapshots of activity but doesn't scale well if an administrator needs to monitor activity across lots of servers at once. This is where PowerShell comes in.
PowerShell Performance Counters
Using PowerShell's Get-Counter cmdlet, an administrator can query this data and build alerts, various triggers or output the data in just about any way she wants. Let's hook into these three performance counters we just went over above but this time with PowerShell.
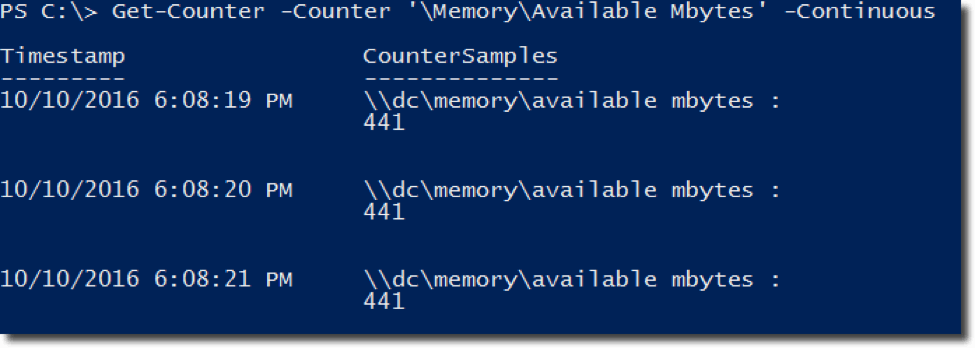
As I mentioned, I'll use the Get-Counter cmdlet to continuously get at the exact same information that Performance Counter was polling.
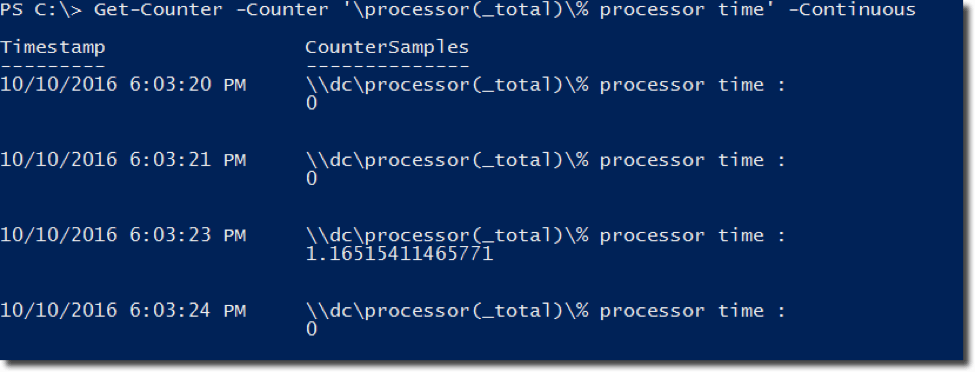
Above, I'm telling Get-Counter I want to see the data for the % Processor Time continuously (once per second) just like the Performance Monitor was doing. I can do the same for the Available Memory performance counter as well.
These counters are all being done locally, but I can gather a point-in-time snapshot of a performance counter across many different remote servers as well.
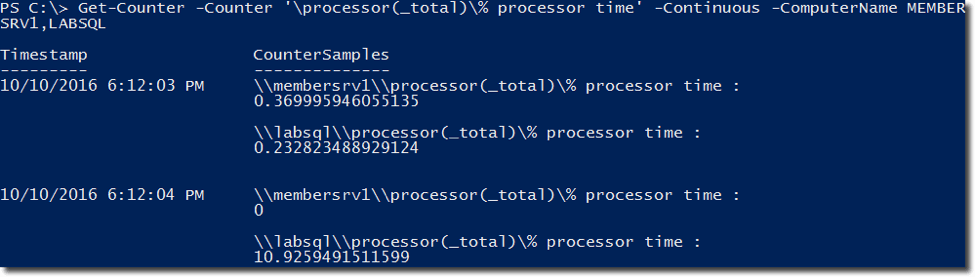
You can see that by using the ComputerName parameter, I can specify as many servers as I want to query.
Performance Counters That Run Continuously
Let's now build a small monitoring tool with PowerShell to keep an eye on a remote server's performance that's easier to read than the default output. To make this happen, we'll need to write some PowerShell to capture the output from Get-Counter on a regular basis and format it into a table.
for ($i=0;$i -lt 5;$i++) {
$counters = Get-Counter -Counter '\Processor(_Total)\% Processor Time' -ComputerName MEMBERSRV1,LABSQL
$properties = @(
@{n='Server';e={$_.Path.Split('\')[2]}},
@{n='Counter';e={$_.Path.Split('\')[-1]}},
@{n='Value';e={[math]::Round($_.CookedValue)}}
)
$counters.CounterSamples | Select-Object -Property $properties
sleep 1
}
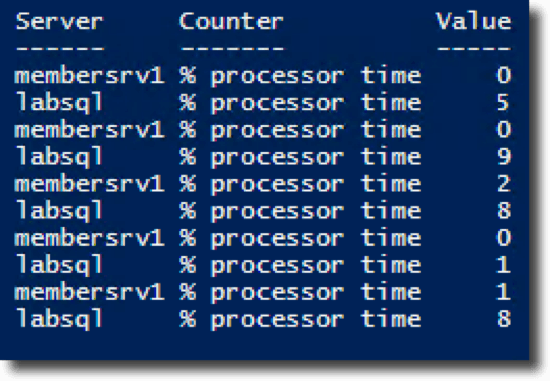
This is some fancy PowerShell code, but this is again just polling a performance counter once per second and doing it for a total of five seconds. Although this time, by using PowerShell, we can manipulate the output to whatever format we desire! Using PowerShell allows you more control.

Adam Bertram
Adam Bertram is a 25+ year IT veteran and an experienced online business professional. He’s a successful blogger, consultant, 6x Microsoft MVP, trainer, published author and freelance writer for dozens of publications. For how-to tech tutorials, catch up with Adam at adamtheautomator.com, connect on LinkedIn or follow him on X at @adbertram.
