PAS for OpenEdge Deferred Logging Integration with EFK Stack

PAS for OpenEdge Deferred Logging
Since Progress Application Server for OpenEdge (PAS for OpenEdge) is a server technology, a common way to diagnose an application problem running in PAS for OpenEdge is to increase the logging level and enable more log entry types in the properties file.
A typical automatic log entry type is a 4GLTrace, which generates a message every time any method or procedure in the application begins and ends. This can generate a lot of information and makes the PAS for OpenEdge agent logfile unmanageable and the messages difficult to filter and view. Writing the log messages to disk also takes more time and can impact the ability to diagnose timing issues because it changes the speed of the execution.
In OpenEdge 12.1, PAS for OpenEdge introduced in-memory or deferred logging, which is enabled by setting few properties in openedge.properties file. Such log messages ordinarily logged to the agent log are instead kept in memory where they can be retrieved on demand or written to the log file on demand using a JMX call. However, there is no way to know how often to retrieve the deferred log messages, and there is no way to direct them to a centralized logging system such as the EFK (Elastic Search, Fluent bit, Kibana) stack, where they can be viewed using a tool like Kibana.
This document describes how to automatically transfer all the log messages written to the in-memory deferred log to the EFK stack where they can be examined using a tool like Kibana.
There are three simple steps to get your deferred log messages to the EFK stack:
- Enable deferred logging for your PAS for OpenEdge instance.
- Set up and configure Fluent-bit.
- Tell your running PAS for OpenEdge instance to begin sending the deferred log messages to the EFK stack.
How to Enable Deferred Logging
Make sure allowRuntimeUpdates property is enabled in openedge.properties file while starting the PAS for OpenEdge server. This will allow us to enable deferred logging without restarting the server.
[AppServer]
allowRuntimeUpdates=1
Deferred logging can be enabled by modifying the following properties under [AppServer.SessMgr] group in openedge.properties file. For more information on deferred logging, refer to the OpenEdge documentation link.
defrdLogEntryTypes=
defrdLoggingLevel=0
defrdLogNumLines=0
defrdLogEntryTypes:
A single entry or comma delimited list of logging entry types for the deferred log buffer.
defrdLoggingLevel:
Logging level for messages into the deferred log buffer. Possible values are:
- 0 - No log file written
- 1 - Error only
- 2 - Basic
- 3 - Verbose
- 4 - Extended
defrdLogNumLines:
The maximum number of lines of log information that may be written to the deferred log buffer, shared by all ABL sessions in an agent. The default value is 0, which disables the feature.
Generate Deferred Log Entries
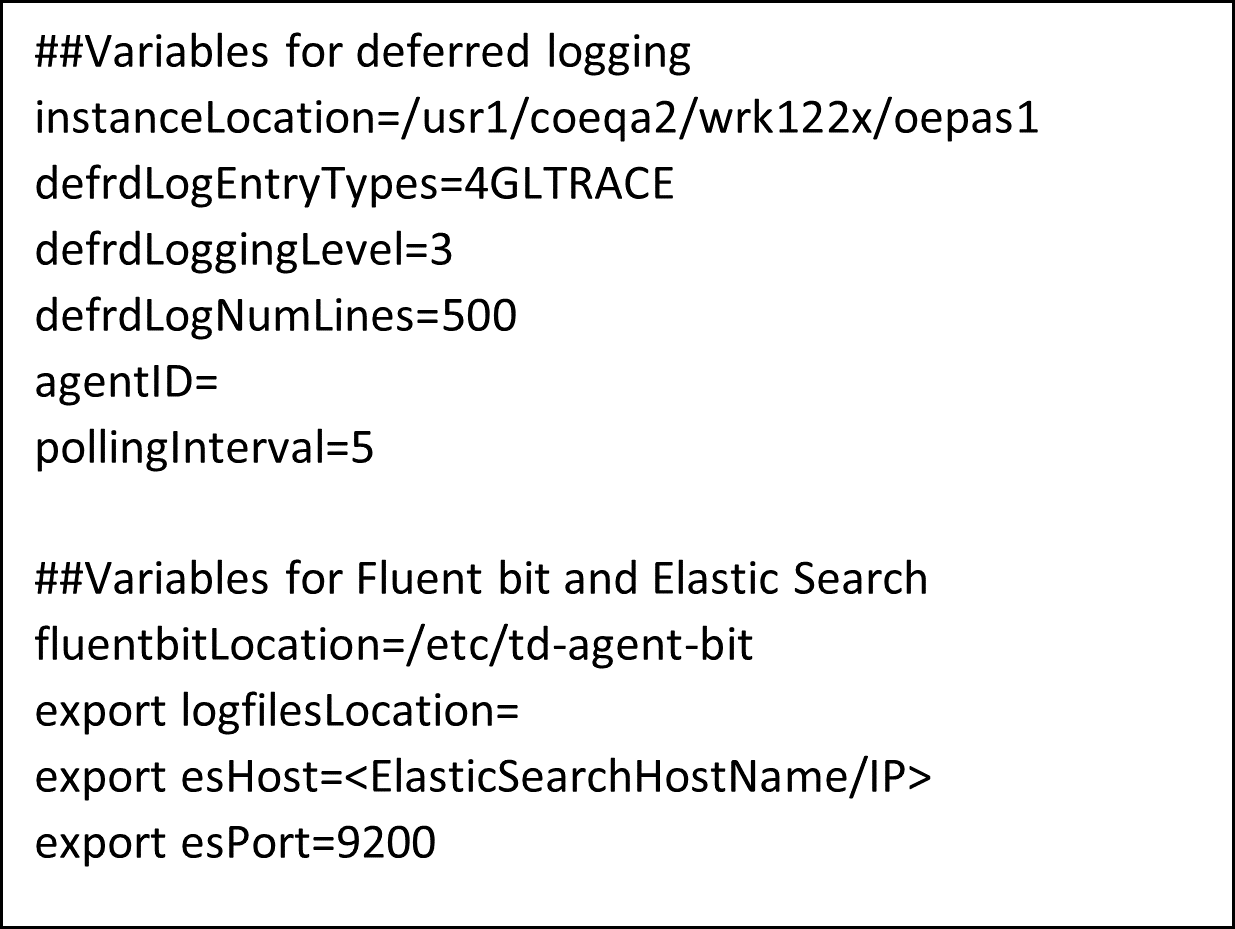
Download the attached zip file and then extract to a folder. Open config.txt file and then update the following values:
- instanceLocation: PAS for OpenEdge instance location
- defrdLogEntryTypes:
- defrdLoggingLevel:
- defrdLogNumLines:
- agentID: PAS Agent ID. (You can get agent ID from tcman.sh plist command)
- pollingInterval: Time in seconds, to flush deferred log entries from in-memory to disk
Sample config.txt file:

Once you update config.txt file, run deferredLogging.sh file which will take care of updating deferred logging entries in openedge.properties file, preparing a JMX query based on agent id and polling interval and then finally run the JMX query to fetch the deferred logging entries.
EFK (Elastic Search, Fluent-bit, Kibana) Stack Integration
Deferred log entry files generated from the above step are taken and then stored into Elastic Search database, and we can view these log entries from Kibana.
To store these log files in Elastic Search, first we need to configure Fluent-bit, which is used to monitor the given file pattern and then send those files to Elastic Search. Setting up EFK stack is out of the scope of this document. Here I’m talking about only Fluent-bit configuration changes that are needed to parse the log entries and EFK integration.
Fluent-Bit Configurations
We need to define log parsers, input and output mechanisms in fluent-bit, to parse the incoming log entries. We also need to input file patterns to parse the data and then find where to store the parsed data. Run configure_fluentbit.sh file, this will take care of configuring fluent bit with deferred log files and parsers.
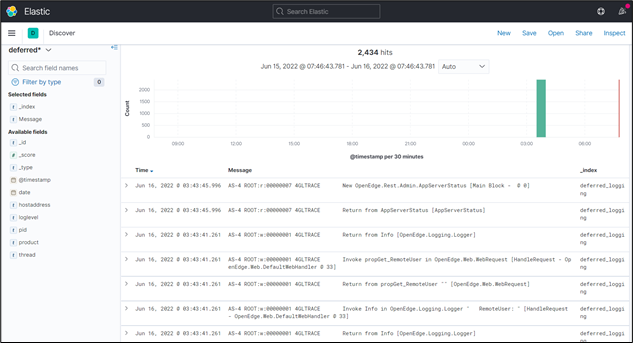
Now start/restart the fluent-bit service, so that it can listen to the specified file pattern changes, and then send those entries to Elastic Search. Once these values are stored in Elastic Search, we can view them via a visualization tool called Kibana. In Kibana, we can configure indexes and filters. We can query the records based on certain messages and even plot graphs.
Sample Screen from Kibana:


Sanjeva Manchala
Sanjeva is a Principal Software Engineer at Progress. He has been with Progress since 10 years, has been associated with Progress Developer Studio for OpenEdge and QACoE lab where he’ll be working on setting up End to End test setups and customer applications in-house.
