Everything You Need to Optimize Your Sitefinity Project Is in Sitefinity Cloud

Sitefinity hosted in the cloud by Progress has the infrastructure and CI/CD pipelines to give developers everything they need to hit the ground running. All the tools are there too to sustain and consistently improve performance because, hey, we’re all in it for the long run.
Last time around, we looked at the infrastructure and systems behind Sitefinity Cloud. A secure, managed environment that has all the tools to develop and quickly deliver updates at scale. Except, the job is far from done once a release is deployed on production. But it may well be where the fun starts.
Cloud Has You Covered
Want to keep an eye on overall system health? Identify performance bottlenecks? Address and resolve issues and optimize your project for stellar performance? The cloud has you covered.
Sitefinity Cloud has the state-of-the-art DevOps tools for automating many tasks related to the development, integration and customization of web assets and that’s just the beginning of the whole story.
Availability and usage insights, comprehensive logs with a query language to aggregate and analyze complex data, performance and monitoring dashboards are also a part of the deal. Interested? Read on for the full rundown.
This blog is part of our continued coverage of Sitefinity Cloud. Following up on the development flow, build and release pipelines and overall availability, we’re taking a closer look at the right tools for keeping your web assets in good health and optimized for high performance.
Now, I guess a bit of tooting our own horn doesn’t hurt but those of you who have been paying attention would know the tools in question are courtesy of Azure DevOps and Azure Monitor. The good guys over at Engineering have just seen to it the whole thing is set-up in line with the best Sitefinity web development practices.
Sitefinity Cloud takes full advantage of all the available performance metrics and troubleshooting tools to keep your project in prime shape. Timed and on-demand database backups and a readily available code repository go without saying. On top of that, you get in-depth performance diagnostics and a rich assortment of logs for thorough system health checks not only after deployment to staging, followed by release on production. A comprehensive, ongoing, finger-on-the-pulse monitoring of your entire project.
Azure Monitor and Application Insights
Configuring your Sitefinity project for maximum performance and stability takes some time and effort. There’s more than one way to get things right and fine-tuning is an art if you want load balancing, geo redundancy, autoscaling, backup and recovery to absolutely click. Now, that may not always be as easy to achieve on-premises.
When done right though, you can count on your Sitefinity Cloud instance to not just behave but impress. And the Azure Monitor package provides everything you need to stay on top, anticipate and proactively resolve issues with your project.
Sitefinity administrators and business-side decision-makers have the means to monitor applications, infrastructure and network. Developers, on the other hand, don’t have to rummage through their code and project file system to identify and resolve potential problems. The powerful analytic engine provides at-a-glance info on what’s right and what’s wrong.
By integrating with Azure App Insights, Sitefinity Cloud leverages a powerful toolset to help developers and website administrators identify issues, understand website usage and analyze use patterns. Live tracking is available for a wealth of metrics and events, but all sorts of data is also stored in comprehensive logs that can be queried and explored in minute detail.
Build logs, for example, report on application status after promoting a build through the CI pipeline. Deployment logs provide detailed information following a deployment to any of your environments. System logs, a.k.a. Sitefinity logs such as exceptions, traces, pageVIews and the like, let you drill down to the specifics of the actual performance, as well as the errors, warnings and unhandled exceptions.
Watch. Analyze. Investigate. Act
It all starts on the dashboard. A couple of them. A Sitefinity admin, or any user with a relevant role and the right set of permissions, has one-click access to high-level metrics to gauge the overall status and health of their application. And there are multiple ways to drill down the telemetry data to analyze, investigate and address any issues that may affect performance and availability.

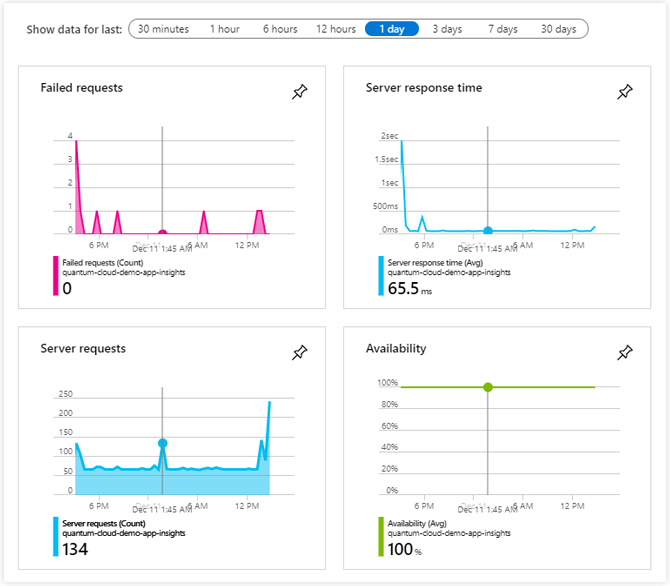
The logs, and the four widgets above for that matter, are convenient entry points into Azure Monitor and the wealth of data streams and diagnostics of Application Insights. The App Insights overview is built around a number of widgets, which keep track of predefined metrics such as availability, server response time and requests, including request failures. You can select a custom period to show data for or drill down for the fine detail.
Now, if that’s what you’re after, Application Insights is the place to be. You get access to tons of meaningful information, both real-time data and aggregate history, about how your application(s) are performing, from high-level infrastructure metrics to code-level visibility of potential problems.
What’s happening and when? What’s causing problems and why? Where are your users and who are they? The answers are right there in the requests, response times and failure rates, the dependencies and exceptions, in the user sessions and page views.
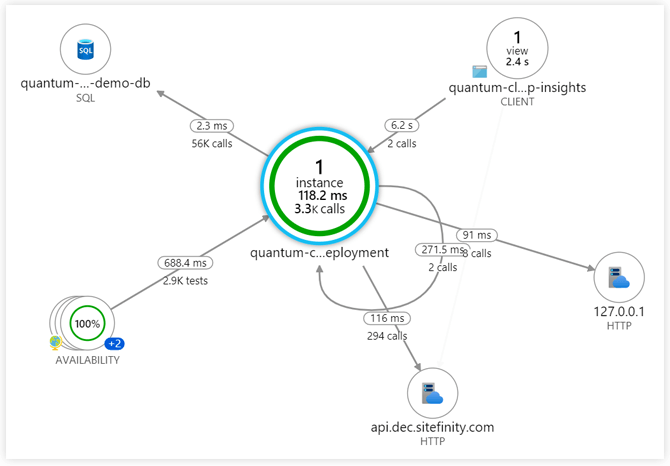
You’ll want to identify potential performance bottlenecks and analyze dependencies within your setup in-depth, especially in a distributed application context. You’ll want to know which requests are taking the longest to execute and examine failures in detail. You’ll want to analyze both server-side operations (performance metrics collected from your application’s components) and client-side data as reported by your users’ browsers.
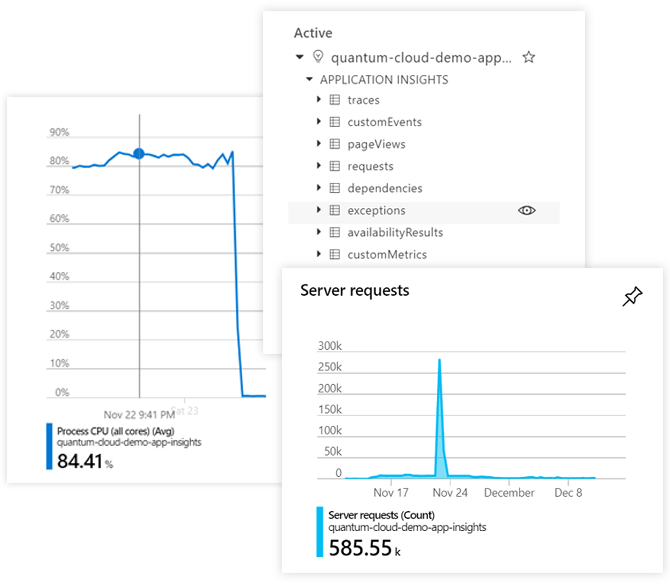
Drill down the logs over custom time ranges for a close look at your application’s performance and cross-reference the data from different sources to identify the cause of a problem and decide on the best solution.
Perhaps a particularly slow operation during peak usage time was gobbling up resources to the point of taking your application down. So, you may want to check for spikes in CPU usage that may’ve caused your app service to restart. Or, maybe an unhandled exception triggered a chain of requests in a loop that the network ultimately couldn’t handle.
Every record in the logs is parsed and the full details of, say, an exception are a click away. You can run queries too to filter out the exceptions you need to analyze.
The data is there when you need it and how you need it. You’re on to make the most of it. Sometimes you want your site(s) firing on all cylinders, other times you need comfortable cruising speed. Sitefinity Cloud has the tools to help you have both, at the right time and the right place.

Talk to a Sitefinity expert today about how to get the most out of your CMS. Sitefinity Cloud taps into a powerful, feature-rich and secure infrastructure with fully-automated DevOps—as well as a host of performance metrics and troubleshooting tools to keep your project in great shape.

